In a B2B business, you rely on various platforms to help you develop and execute your inbound marketing strategies. But, tracking your data across all those platforms can make it challenging to identify what is working and what is not.
Not only do you waste time jumping from platform to platform trying to piece together your performance, but, it also makes it hard to communicate your results with team leaders and other stakeholders.
That is why a reporting dashboard is so important. Businesses can use reporting dashboards to analyze data from multiple sources in order to guide future initiatives and further improve performance.
In this guide, we will explore the benefits of using a reporting dashboard in B2B business and how you can use a tool like Databox to help you monitor, analyze and improve business performance.
4 Benefits of Using Reporting Dashboards In B2B Business
1. Aligning Team Members Around What Matters
Monitoring and tracking your performance across various tools can make it hard for you to communicate the impact of your efforts. With a reporting dashboard, you can combine data from all of your platforms into a single view making it easy to share your results across teams and departments. By creating a single source of truth, you can ensure that every team member is aligned around the right metrics and that everyone is working towards the same common goal.
2. Tracking And Proving Your Efforts To Business
Reporting dashboards make it easy for you to showcase your progress towards a certain goal. You can use the data in your dashboard to highlight the results you have achieved for specific campaigns or initiatives as well as the ongoing opportunities to improve performance.
3.Making Data-Driven Decisions
A reporting dashboard will provide you with insights to help you make better and smarter business decisions. By tracking your data in real-time, you can also optimize performance by being able to quickly make judgments on current initiatives. Using a reporting dashboard means you are able to make reliable and relevant business decisions.
4. Monitoring Trends For Business Improvement
Monitoring your performance over time can help you identify trends in your data to help you better understand your business growth. By using a reporting dashboard, you can report on a past time period in order to help predict how current strategies will affect future performance.
Trends analysis is a great way to identify the areas you have excelled at in the past, identify areas in which your business has been consistently underperforming, and provide historical performance to prove decision making.
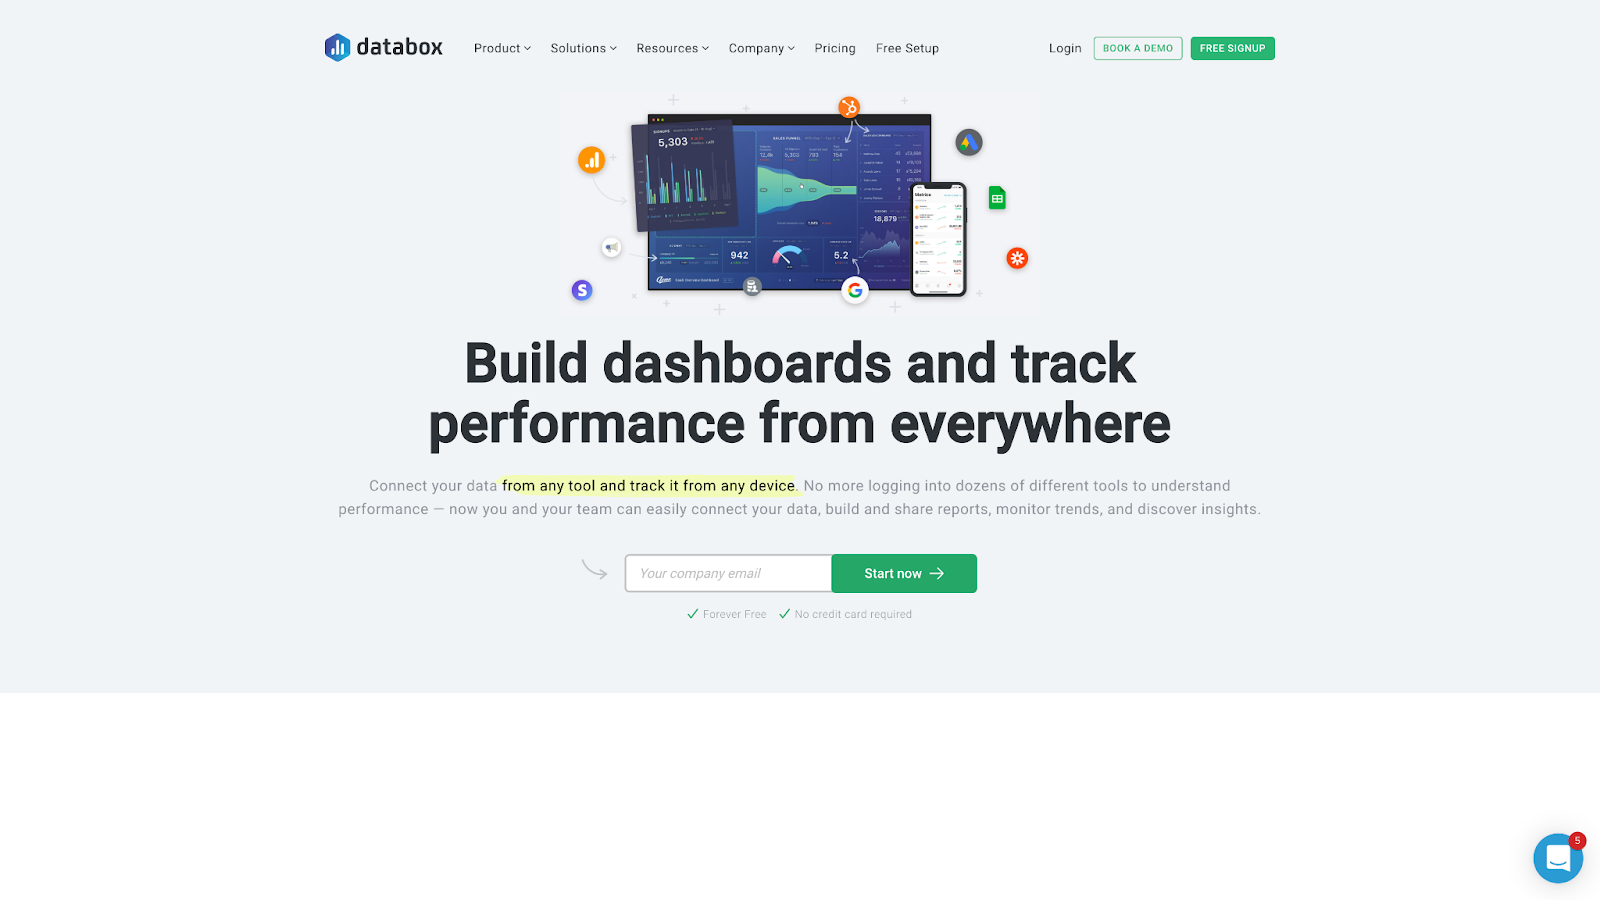
What Is Databox?
Databox is a Business Analytics platform designed to help companies monitor, analyze, and improve the performance of the metrics that matter the most. With Databox, you have access to a variety of reporting features that allows you to align teams around the right metrics and goals, track your performance in real-time, effectively monitor data to capitalize on future opportunities, and automate reporting.
Databox For B2B Businesses
Here are a few features in Databox that you can use to improve business performance.
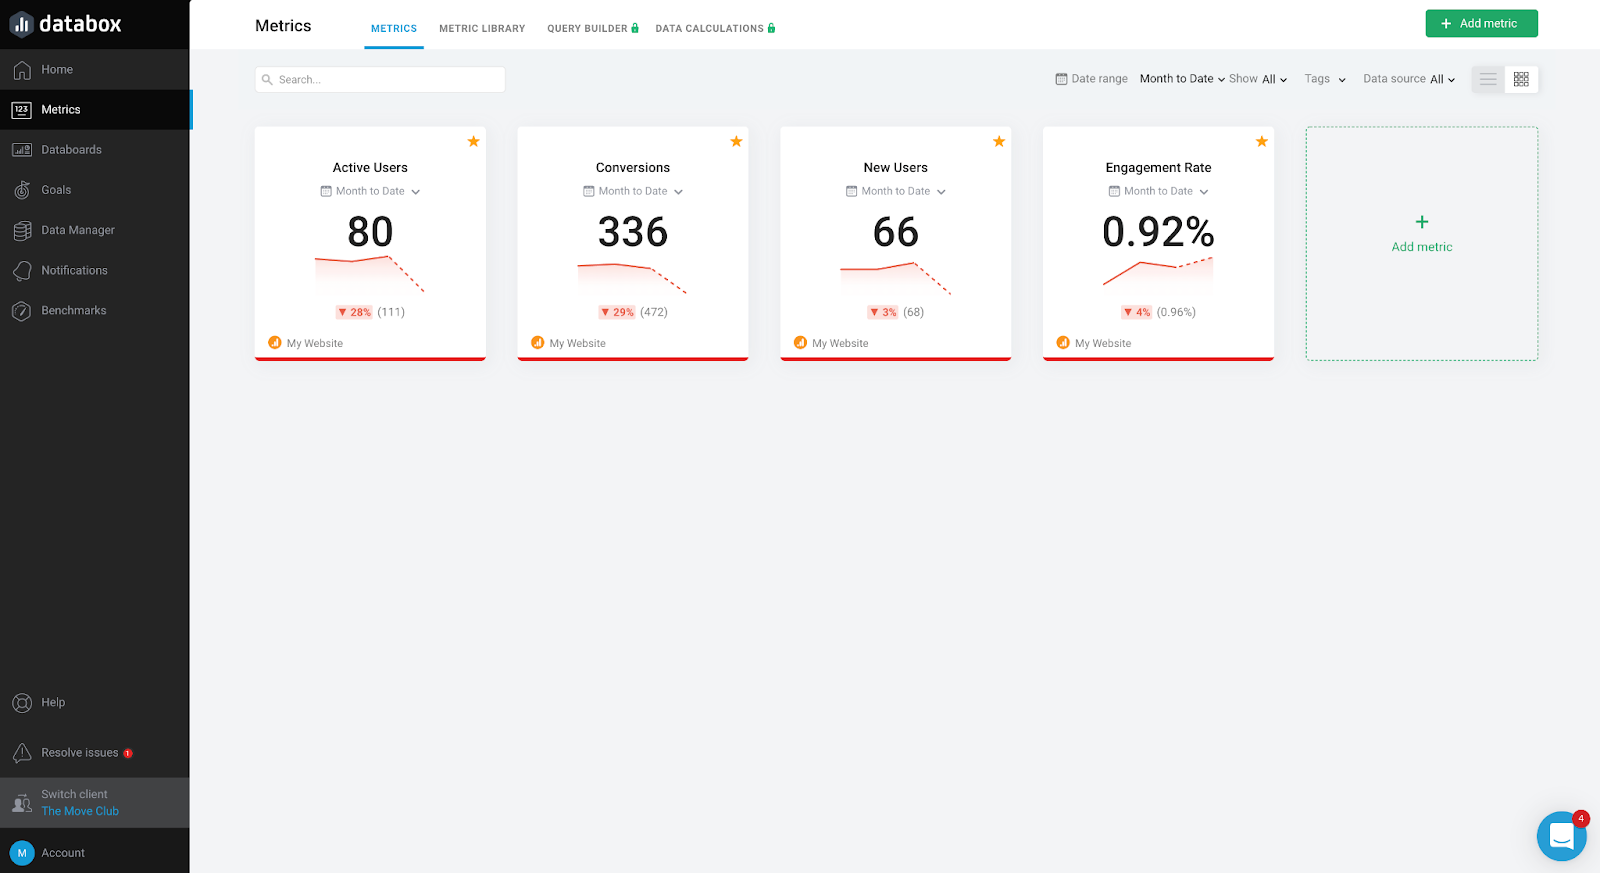
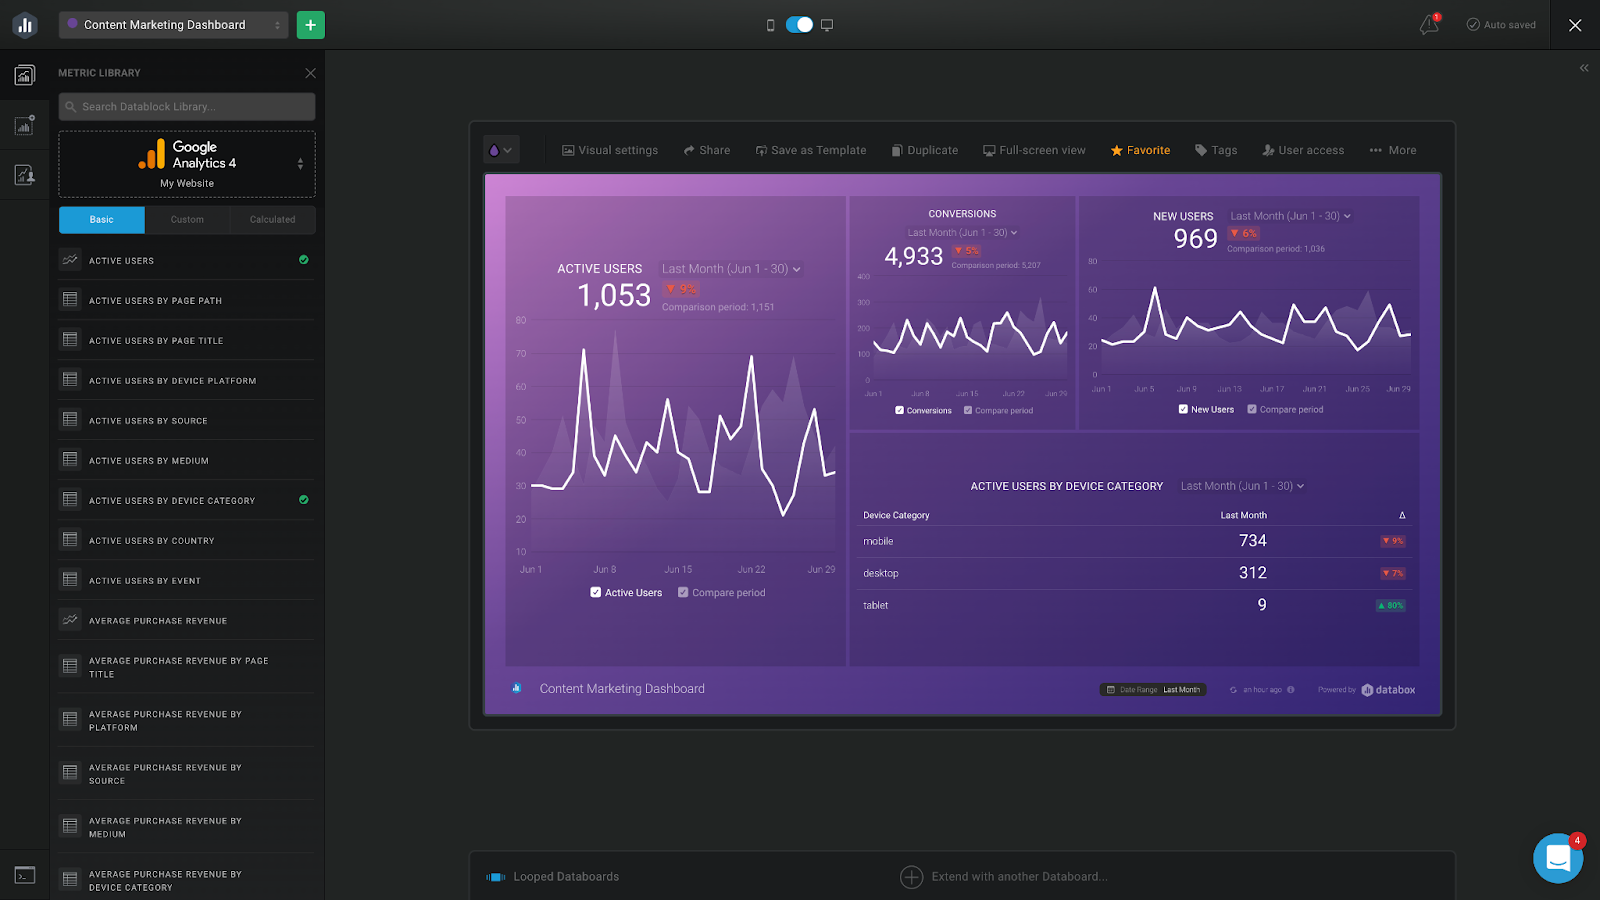
1. Metrics Screen
You can use the Metrics Screen in Databox to align your team members around the metrics and goals that matter to your business. You can choose the metrics you would like to track from the Metrics Library.
Once you have finished adding metrics to your Metrics Screen, you can invite your team members to do the same, allowing you to easily visualize and verify the data.
2. Dashboards
With Databox Dashboards, you can track all of your data in one place. You can build custom dashboards in a matter of minutes using the pre-built metrics available for each Data Source.
Once you have created your Dashboards, there are various ways you can share your data. The most common ways are by using a shared link, creating a scheduled snapshot, or casting it on your company TV. No matter what device you are using, your dashboards are optimized to adapt to any device and screen size, making it easy to track your data in real-time.
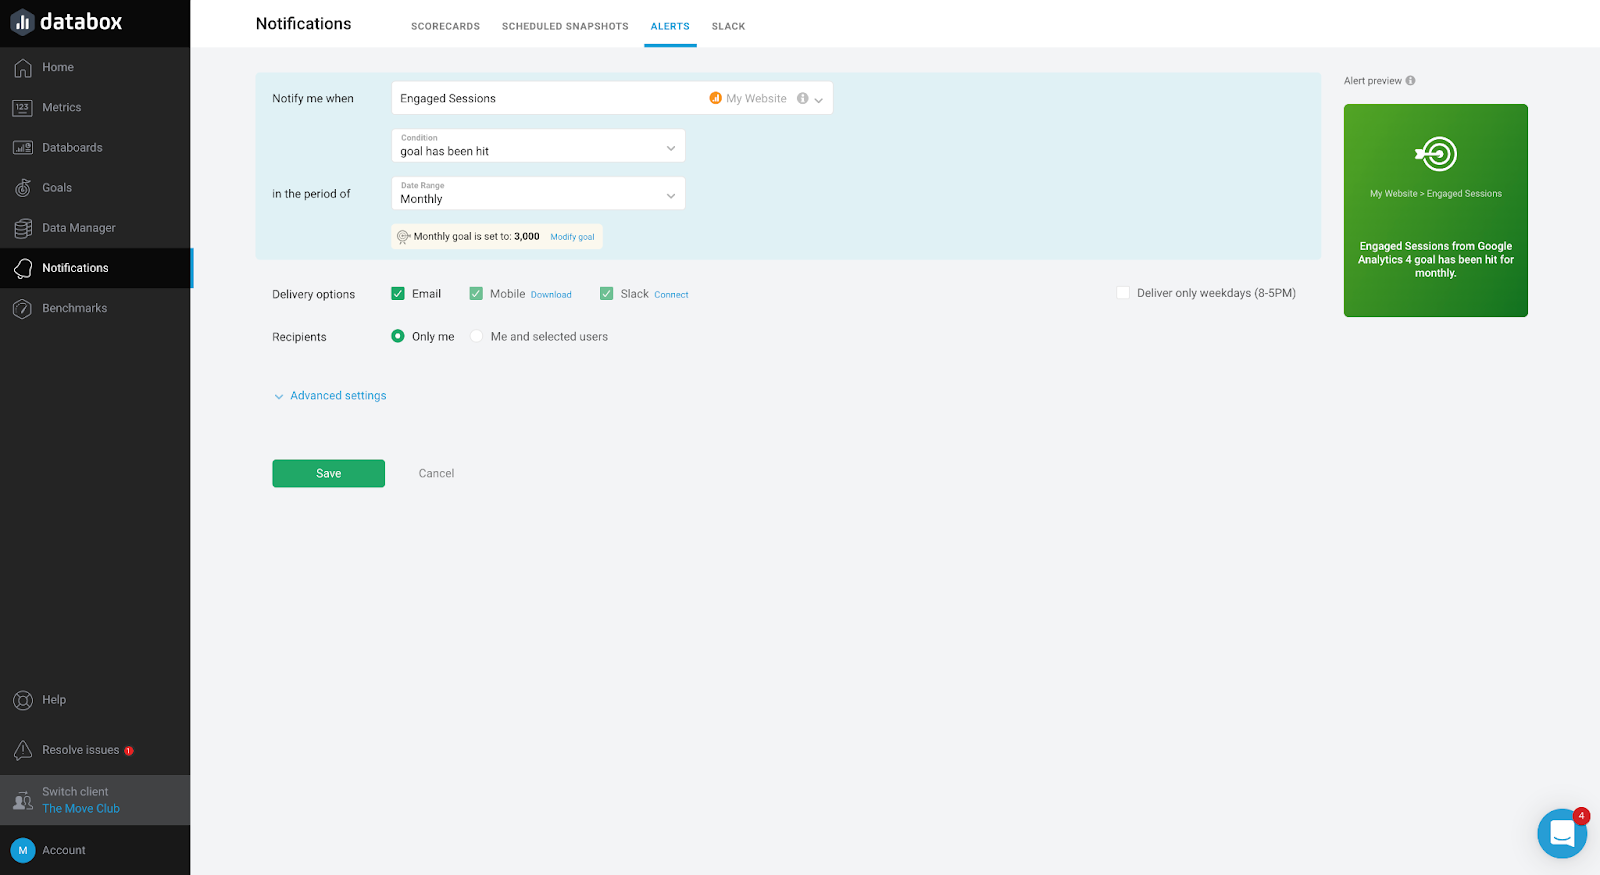
3. Alerts
Alerts help you automatically and proactively monitor your data by notifying you of any emerging trends.
This means that when an Alert is triggered, you and your team can review your Dashboards to determine if any changes are required to improve performance or to draw correlations between the work you are doing and the results you are seeing.
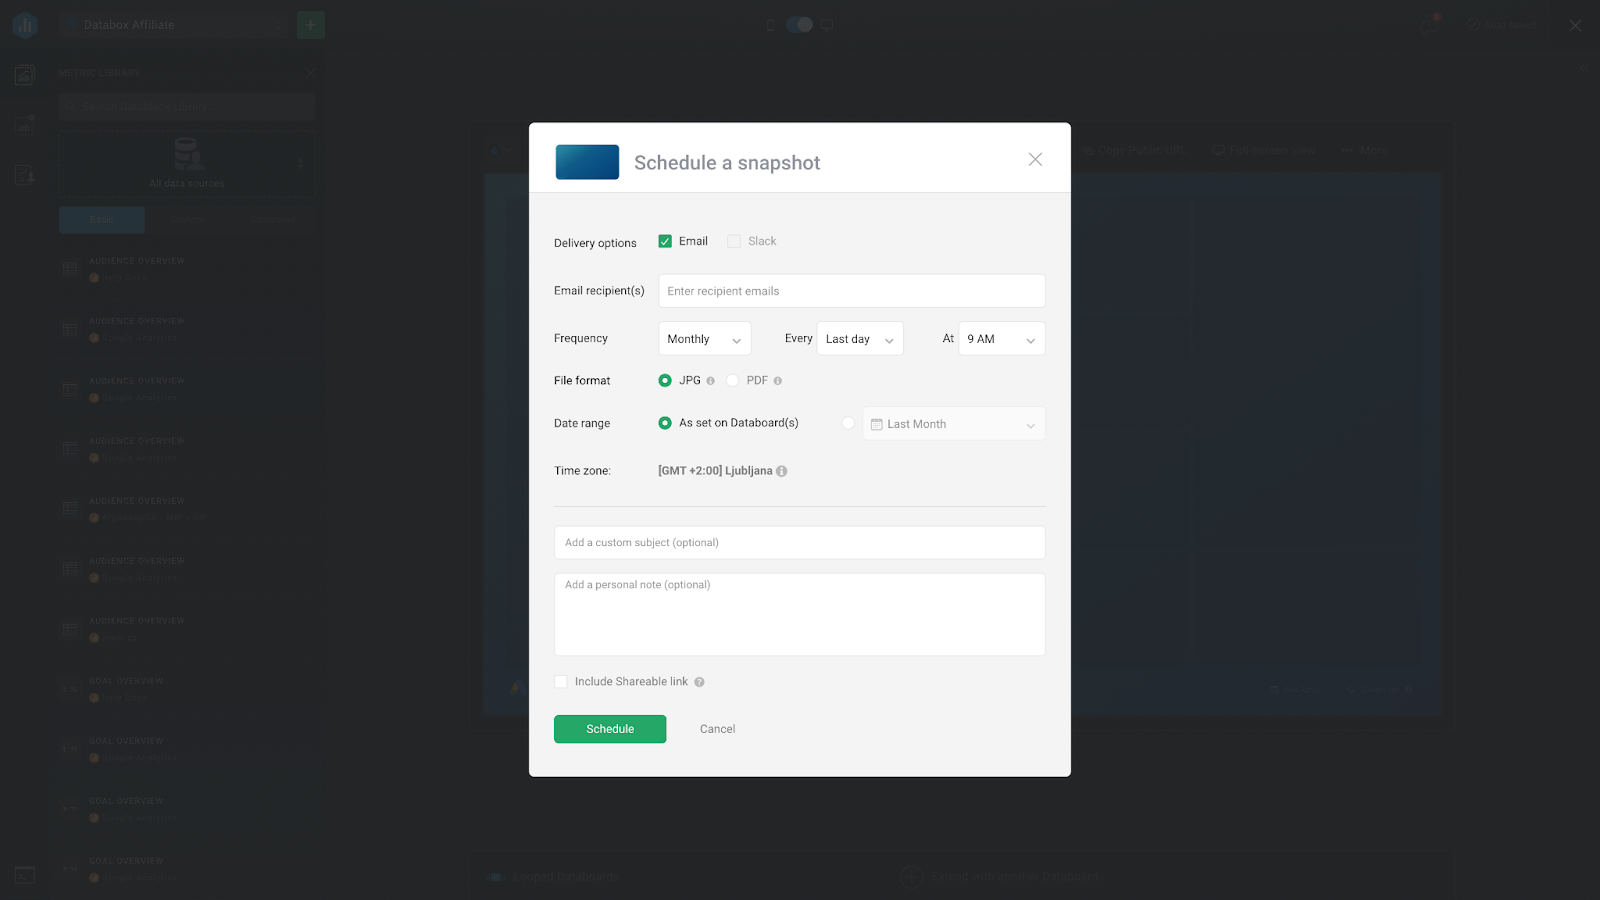
4. Scheduled Snapshots
With Scheduled Snapshots, you can export your dashboards into PDFs or JPGs at regular time intervals. Scheduled Snapshots are a great way to archive data on part performance and to help you make data a more regular part of your routine.
When setting up a Scheduled Snapshot you can select multiple recipients, specify your custom frequency, define your file format, select a custom date range, and even set up a personalized subject line and email copy.
Free Ready-to-use Marketing Dashboard Templates
With Databox, you get access to hundreds of pre-built dashboard templates that include the most common metrics and KPIs across all departments and use-cases.
Google Ads Dashboard Templates
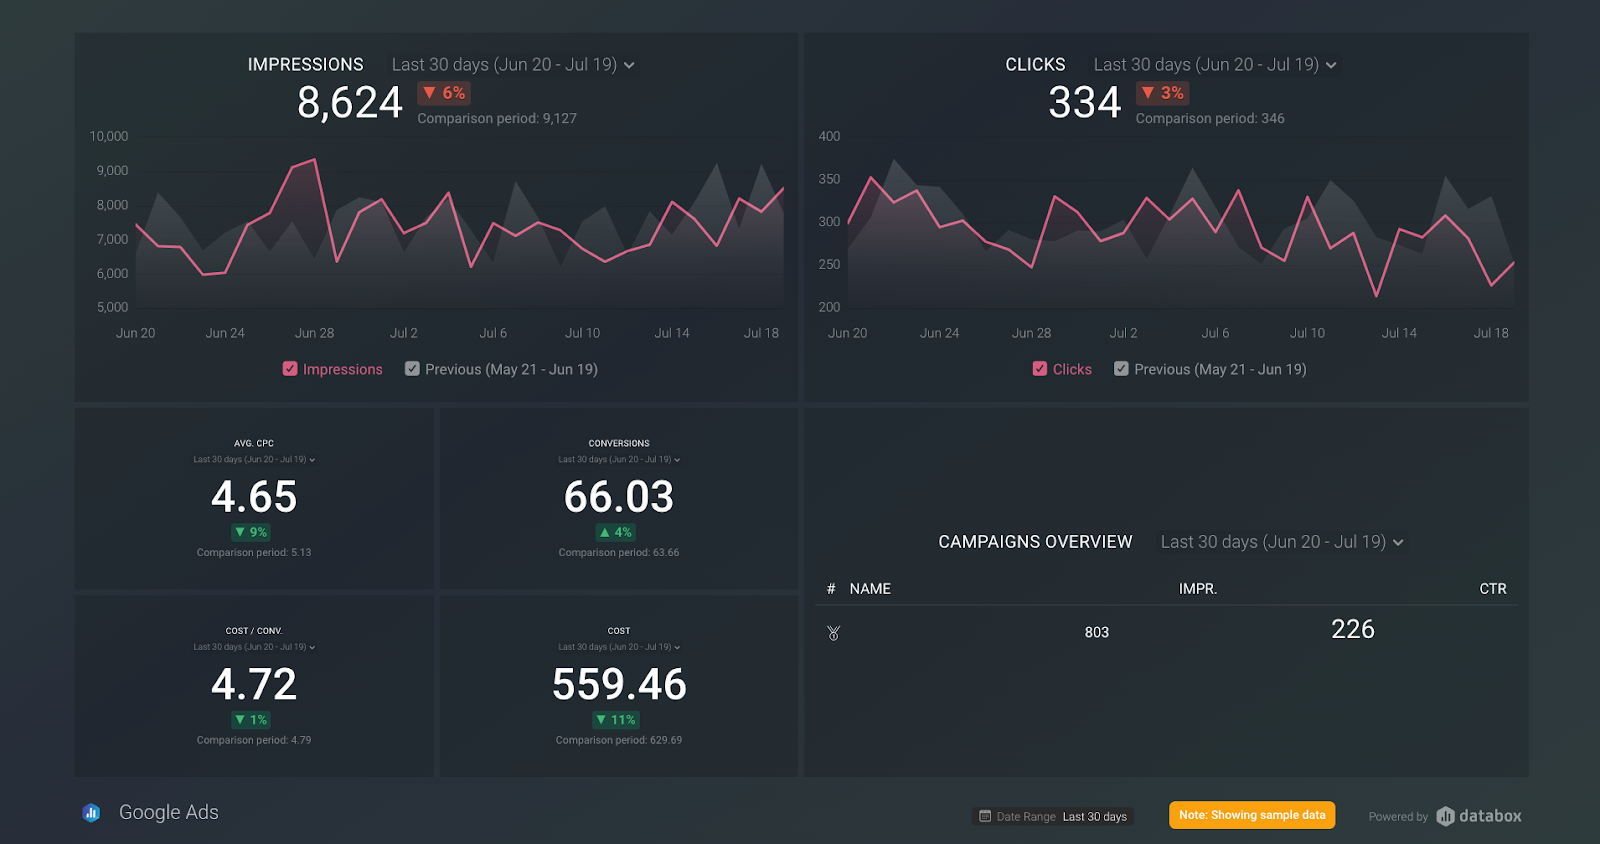
Snippet: You can use this dashboard template to easily track and analyze the most important metrics of your Google Ads campaigns to help you improve your ROI.
Integration: Google Ads
HubSpot Email Marketing Overview Dashboard
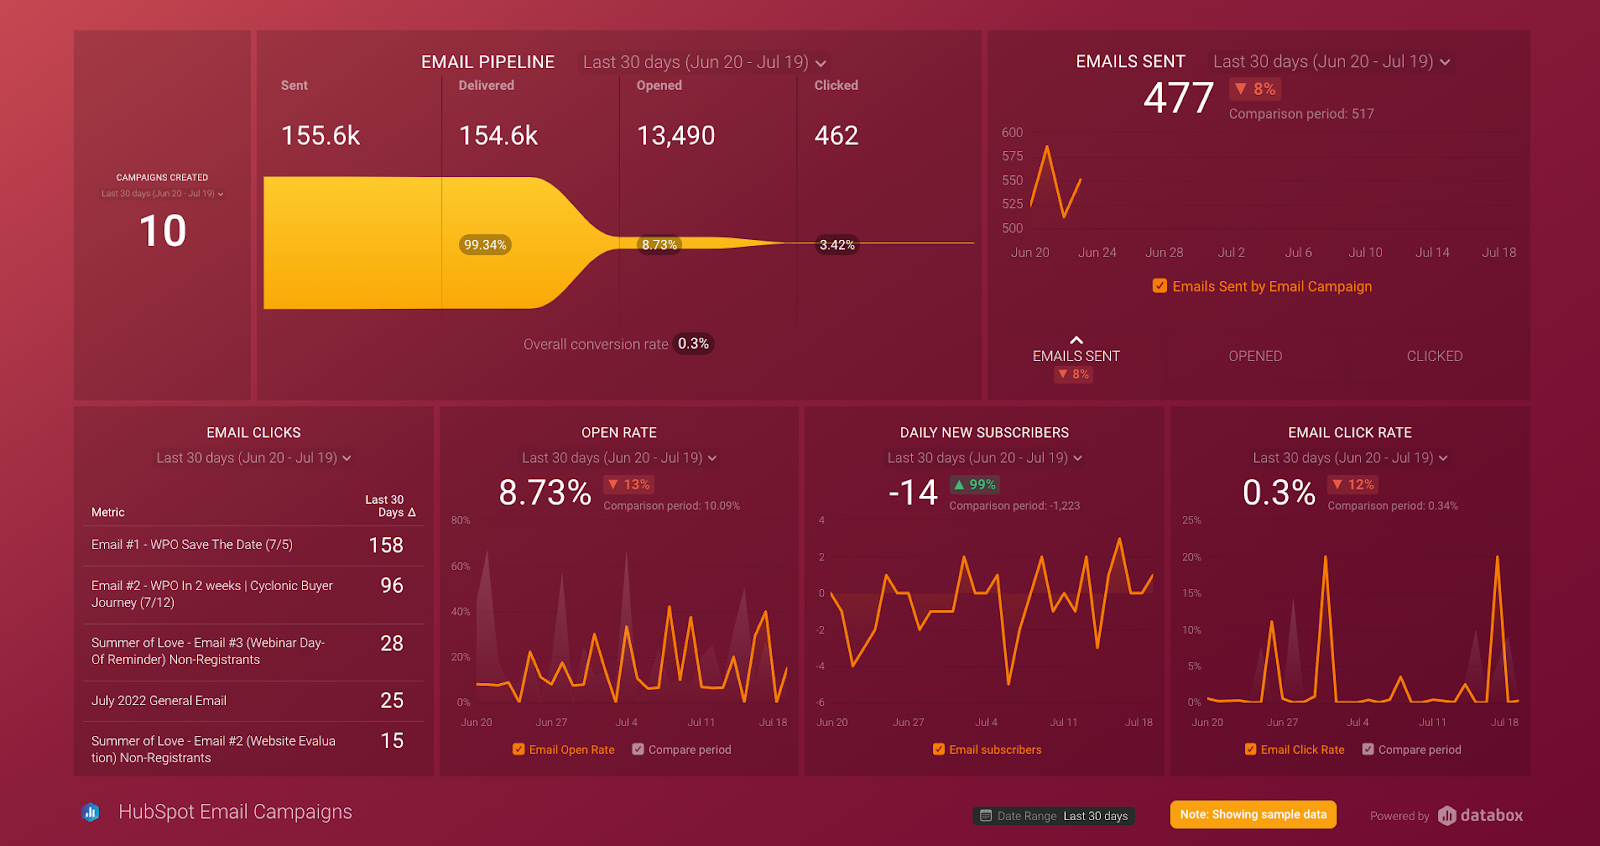
Snippet: With the HubSpot Email Marketing Overview dashboard you can track and measure the overall performance of your email marketing efforts.
Integration: Hubspot Marketing
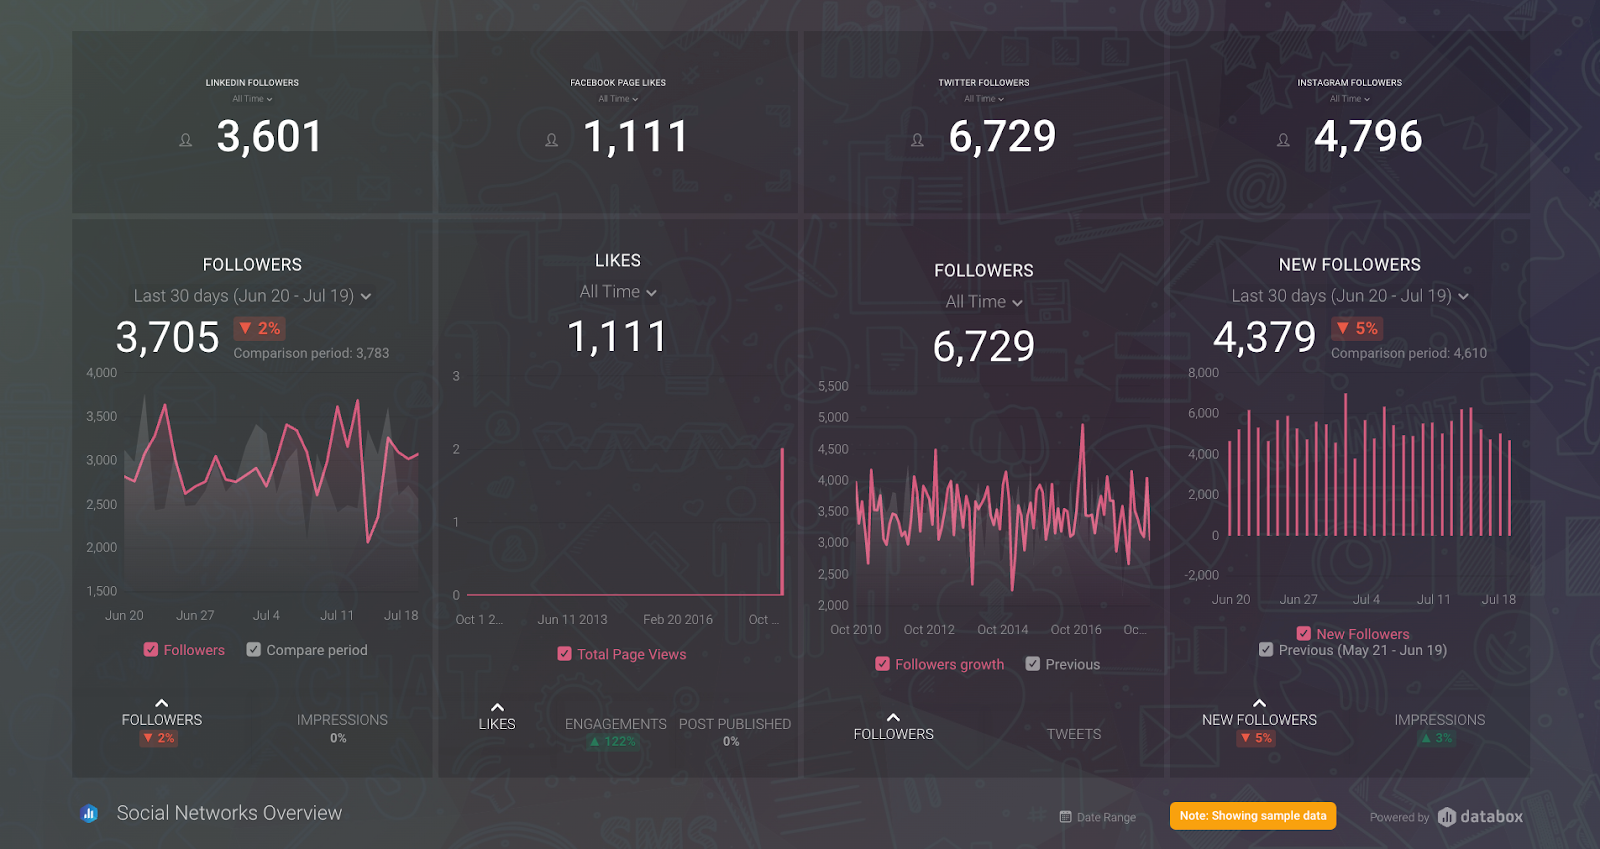
Social Networks (Growth & Engagement) Dashboard Template
Snippet: You can use this dashboard template to track and manage your activities and their performance across the most popular social media platforms. By including key metrics, you can easily evaluate if your social media efforts are paying off.
Integration: Instagram Business, LinkedIn Company Pages, Twitter, and Facebook Pages.
SEO Overview Dashboard Template
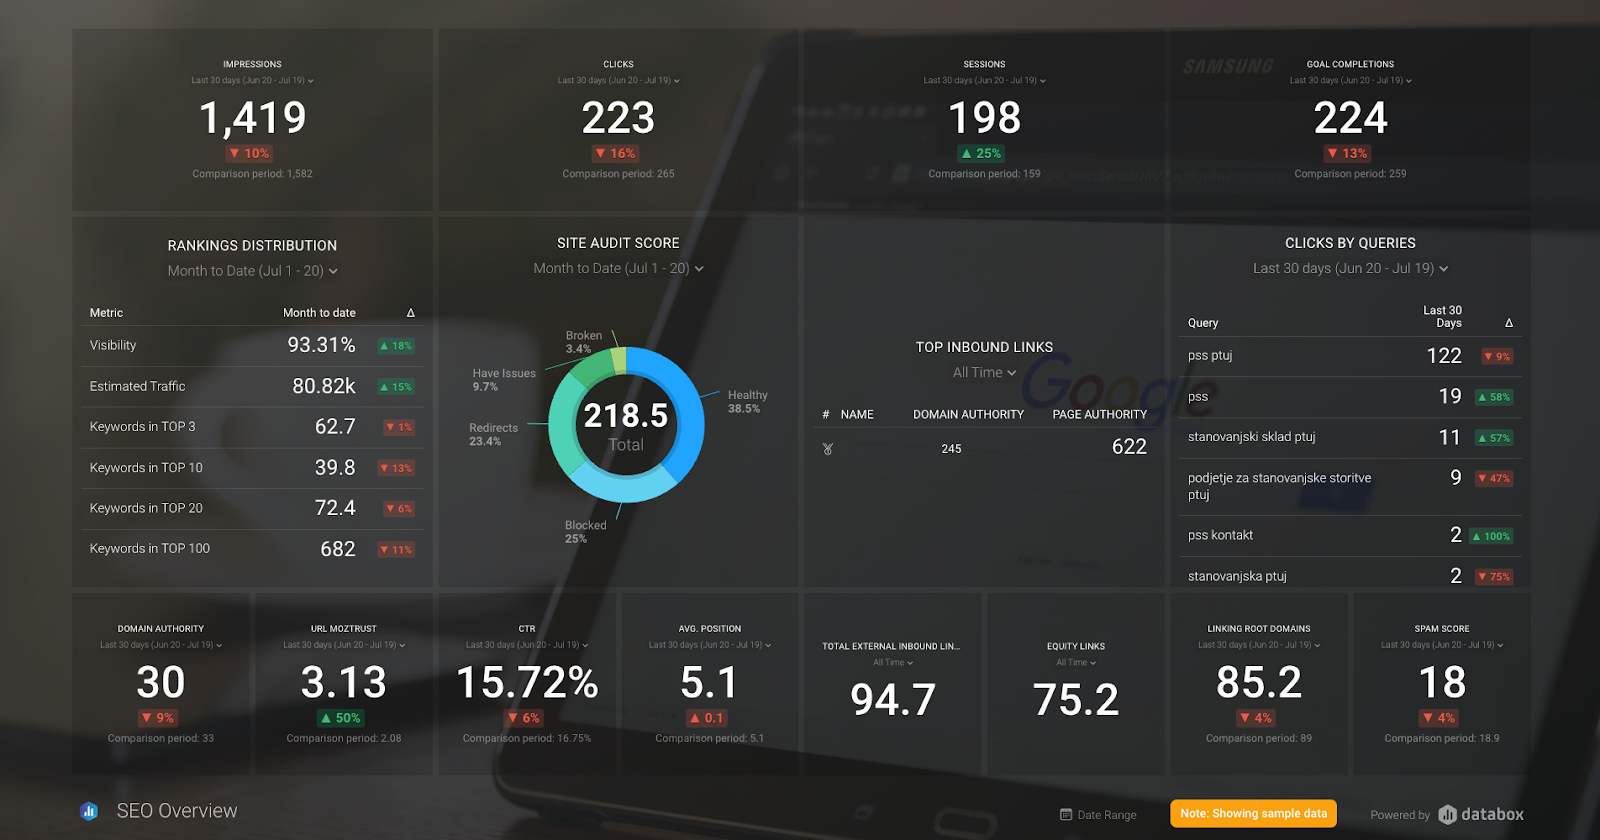
Snippet: The SEO Overview Dashboard template combines data from popular platforms to help you track the overall performance of your SEO efforts.
Integration: Google Analytics, Google Search Console, SEMrush, and Moz.
Google Analytics (Content Marketing Drilldown) Dashboard Template
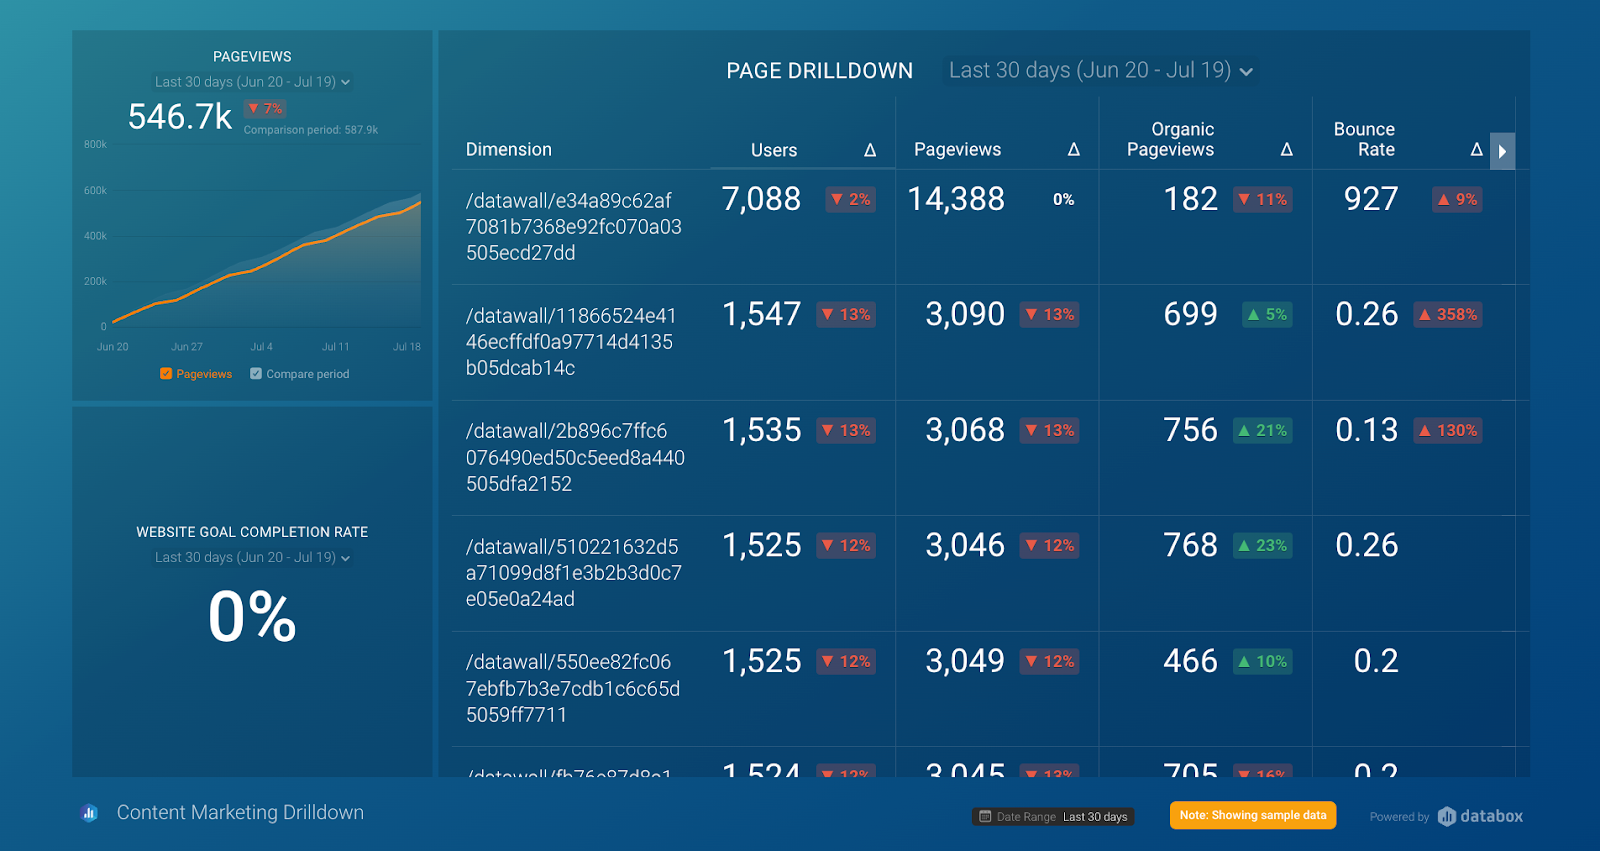
Snippet: You can use this dashboard template to track and compare the performance of your website pages and monitor important engagement metrics.
Integration: Google Analytics